Follower growth is the change in the number of accounts following a social media profile over a chosen time window, usually expressed as a percentage of the starting follower count, and used as a directional signal of whether content is reaching new audiences and converting them into a longer-term relationship with the account.
What is follower growth?
Follower growth is the metric brands and creators use to track whether the audience around an account is getting bigger and how fast. Buffer's glossary entry on follower growth defines it as the increase in the number of people subscribing to or following a profile over time, with the caveat that follower count on its own is a thin metric and only really means something when paired with engagement and conversion numbers. That caveat is the entire reason the rest of this page exists.
The shape of the metric is simple. Pick a window (a week, a month, a quarter), record the follower count at the start, record it at the end, and turn the difference into a percentage of where the account started. That percentage is the follower growth rate, and it is the version of the metric that lets two accounts of very different sizes be compared on the same scale. An account at 800 followers gaining 80 in a month is at the same growth rate as an account at 80,000 gaining 8,000.
The reason follower growth still gets reported on at all is that it is the cleanest single number to put in front of a client or a board: the audience grew this much. The reason it is no longer the headline metric in most reporting decks in 2026 is that it has decoupled from actual reach on the platforms where the recommendation feed (TikTok, Reels, Shorts, X For You) does most of the distribution. A creator whose follower count crawls along at 0.4 per cent monthly can be putting up videos with millions of views, and a creator adding 3 per cent monthly through bought followers can be getting almost no real reach at all.
The follower growth rate formula
The standard formula, as written up by Socialinsider in their reference piece on calculating follower growth, is straightforward enough to do in a notes app:
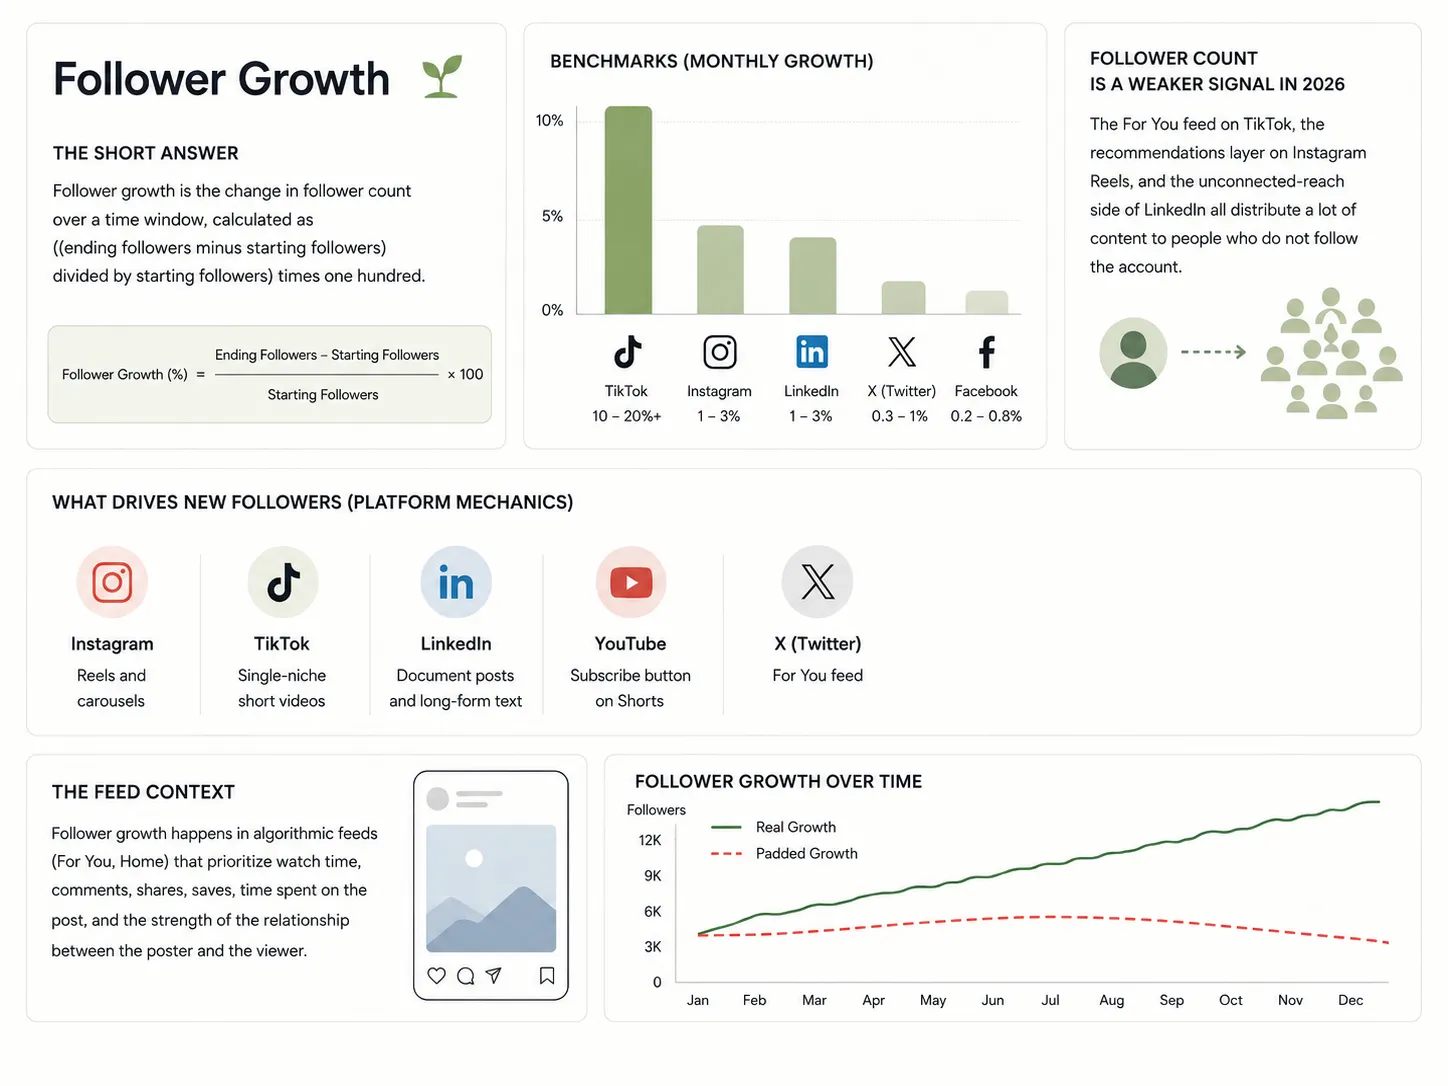
Follower growth rate (%) = ((Ending followers − Starting followers) ÷ Starting followers) × 100
Worked example: an account that starts a month with 5,000 followers and ends with 5,200 has a net gain of 200, divided by the starting 5,000 to get 0.04, multiplied by 100 to get a 4 per cent monthly follower growth rate. The same arithmetic works on a weekly, quarterly, or annual window, and the only rule that really matters is to pick one window and stay on it through every report.
The two variations on the formula worth knowing about are net new follower count (the raw number, with no percentage) and follower growth rate against a benchmark (the same percentage divided by an industry average to get a relative score). Most platform-native dashboards now expose both the raw number and the percentage, with Instagram Insights and TikTok Studio defaulting to a 28-day window and LinkedIn Page Analytics defaulting to a 30-day window.
The trap with the formula is the choice of starting count. If the account had a viral post in the last week of the previous month and the starting count is artificially elevated, the growth rate for the new month will look low compared to a more typical baseline. The cleanest version is to roll a 90-day average for the starting and ending counts, which smooths out the spikes a single big post can produce.
What counts as a healthy follower growth rate by platform
Benchmarks vary wildly by platform, account size, and industry, and the headline numbers from different reports do not line up because they use different windows and samples. Hootsuite's 2026 social media benchmarks report publishes weekly follower growth rates that show TikTok averaging around 197 per cent week-on-week across industries, with Instagram, Facebook, and LinkedIn sitting in the low single digits on the same window. Most marketing teams convert those into the more familiar monthly numbers below.
1 to 3 per cent monthly is the working benchmark on a healthy account, with new accounts under 10,000 followers often pulling 5 per cent or more during the first six months and large accounts settling closer to 0.5 per cent. Reels are the strongest single driver of new followers because they earn the bulk of unconnected reach in 2026.
TikTok
The widest range of any platform. Accounts that hit the For You feed regularly can grow follower count by 20 to 50 per cent in a single month off two or three videos; accounts that never break through can sit flat for months. The average is meaningless without segmenting; the median creator on TikTok is at single-digit monthly growth and the long tail at the top is what pulls the average up.
1 to 2 per cent monthly is a healthy band on a personal profile that posts consistently, with company pages typically half that. LinkedIn rewards the long-form text post, the document carousel, and the comment-driven thread; follower growth on LinkedIn is heavily comment-driven because comments push the post into the second-degree network where new followers actually come from.
YouTube
Subscriber growth on YouTube splits between long-form (slow, steady, driven by recommendations next to existing watch time) and Shorts (fast, spikier, driven by the Shorts feed). A healthy long-form channel adds 0.5 to 2 per cent of its subscriber base per month; a healthy Shorts-led channel can add 5 to 10 per cent through the subscribe-from-Shorts pipeline that YouTube introduced in 2022 and has kept widening since.
X
0.2 to 1 per cent monthly is the band most active accounts sit in. The For You feed has shifted X away from follower-driven distribution, so a creator can rack up millions of impressions while adding only a few thousand followers. The reverse is also common: large legacy accounts with stagnant follower counts whose posts are still doing real distribution numbers.
0.2 to 0.5 per cent monthly on a typical page. Facebook has been the slowest platform on follower growth for several years, and the practical answer for most brands is to treat the page as a distribution surface for paid reach rather than an organic audience-building engine.
The honest framing for any of these benchmarks is that they are useful for orientation and almost useless for declaring whether a specific account is above or below some precise platform-wide threshold. The comparison that actually tells you something is the account against itself a month, a quarter, and a year ago.
Why follower count matters less in 2026 than it did in 2018
In 2018 a follower was a near-perfect proxy for reach. The feed on every major platform was sorted reverse-chronologically from the accounts you followed, with a light algorithmic re-rank on top, and the practical effect was that adding a follower added a near-guaranteed slot in their feed. The follower count was, more or less, the audience number.
In 2026 that connection is most of the way broken. The For You feed on TikTok and the recommendations layer on Instagram Reels, YouTube Shorts, and X For You all distribute the majority of their content based on signals like watch time, sends, saves, and topical relevance rather than the follow-graph. Hootsuite's 2026 guide on the Instagram algorithm splits distribution into connected reach (people who follow you) and unconnected reach (people who do not), and unconnected reach is now the larger half on most Reels-led accounts.
Adam Mosseri's explainer on Instagram ranking makes the same point from inside the company: there is no single algorithm anymore, and the systems that decide what to recommend on Reels and Explore weight signals that are independent of whether the viewer follows the creator. A Reel can earn millions of views from people who have never seen the account before and may never follow it.
The practical effect is that follower count has shifted from a measure of audience to a measure of relationship strength. It still matters: followers are the slice of the audience the algorithm is most likely to keep showing the account to, partnership managers still scan it as a credibility signal, and a brand with one million Instagram followers has a baseline of distribution that a brand with five thousand does not. It is no longer the same thing as audience size, and the reporting decks that still treat it as such are measuring the wrong number.
How follower growth actually works on each platform
Each platform has its own pipeline that turns a stranger into a follower, and the lever that actually moves the number is different on each one. The shortcut of post good content consistently is true everywhere and useless as a plan because good means a different thing in each place.
Instagram (Reels and carousels into the profile)
The discovery engine is Reels. A Reel earns unconnected reach through the Explore and Reels feeds, a viewer taps through to the profile, sees three or four more posts that line up with the Reel they liked, and follows. Carousels are the conversion format for that profile visit because they hold attention long enough for the viewer to read enough of the account to commit. Later's 2026 algorithm guide notes that Trial Reels (videos shown first to non-followers as a test) are now the standard way creators stress-test new content for follower-conversion potential.
TikTok (For You into the profile)
TikTok is the most extreme example of the recommendation-driven model. A video lands on the For You feed of people the algorithm thinks will like it, the strongest reactions to the first three seconds drive further distribution, and the watch-time-completion rate decides whether the video keeps spreading. Followers come from the small share of viewers who tap through and see a coherent niche on the profile. A scattered profile with three different topics converts at a much lower rate than a tightly-themed one, which is why TikTok in 2026 rewards single-niche obsession.
LinkedIn (comments into connections into followers)
LinkedIn growth is comment-driven in a way no other platform is. A post earns reach through the immediate network, comments by people in that network expose the post to their networks (the second-degree audience), and the people who keep showing up in the comments on the same kind of post over a few weeks are the ones who follow. Document posts and PDF carousels have become the highest dwell-time format on LinkedIn in 2026, which translates directly into the algorithm pushing them further.
YouTube (Shorts into long-form into subscribers)
Subscribers on YouTube come through two pipelines. The slow pipeline is long-form: a viewer finds a video through search or the home recommendations, watches enough of it to trigger the subscribe prompt, and subscribes. The fast pipeline is Shorts: a Short earns Shorts-feed views, the viewer taps the channel name, finds the long-form library, and subscribes. The Shorts-to-subscriber pipeline has been the single biggest driver of subscriber growth on YouTube since 2023, and it works best when the long-form content backs up the topic the Short was about.
X (For You and replies)
X follower growth in 2026 splits between the For You feed (which surfaces posts to people who do not follow you based on engagement velocity and topical interest) and the reply economy (where replying to larger accounts earns impressions that convert a small share into followers). Long-form text posts and threads convert at a higher rate than single short posts because they give the viewer enough of the account to decide whether to follow.
Facebook (mostly paid)
Organic follower growth on Facebook is small and slow on most pages, and the realistic answer for most brands is paid reach (page-likes campaigns and post-boosts that surface the page to lookalike audiences). The platform's organic discovery surfaces are weaker than every other major platform's, which is why most growth on Facebook comes from spend rather than content.
The single shared pattern across all six is that follower conversion happens at the profile, not at the post. A viewer sees the post, taps through, looks at the wider account, and either decides this is a thing they want more of or scrolls away. The work that drives a high follower-conversion rate is as much in how the profile reads as in any single piece of content.
Organic vs paid follower growth
Organic follower growth is anything that happens because of the content itself, with no media spend behind it. Paid follower growth covers everything from page-like campaigns and follower-objective ads to the influencer collaborations that put the account in front of a paid creator's audience. Both produce follower count; the followers behave very differently after they arrive.
Organic followers come because they liked something specific the account posted, which means they tend to engage with the next post at the rate the original post earned. Paid followers, especially from broad-targeting page-like campaigns, often engage at a fraction of the organic rate because they followed for a one-off reason (a giveaway, a specific ad creative, a friend's recommendation) rather than the wider account. The follower count goes up; the engagement rate goes down; the algorithm reads that drop and cuts distribution.
The other paid path worth distinguishing is buying followers, which is a separate thing from running ads. Bought followers are bot accounts or low-quality real accounts paid to follow, and they do nothing useful for the account: they push the engagement rate down, they show up as obvious low-quality entries in the audience breakdown, and they get purged in batches when the platform runs its periodic bot sweeps. The follower number looks better for a few months and then collapses publicly.
How to tell real follower growth from fake
Real follower growth is boring to look at. The line goes up steadily, with the occasional bump from a viral post, and the engagement rate on the most recent posts holds steady or rises in line with the new followers. Fake or padded follower growth shows up as a step-change on the chart (a jump of 5,000 followers overnight with no corresponding viral post), an engagement rate that drops sharply against the new baseline, or a comment section that fills up with single-emoji bot replies and accounts whose own profiles are obvious low-effort.
Engagement against new followers
The fastest tell. Track the engagement rate on the ten posts before a follower spike and the ten after. If the rate is flat or up, the new followers are real. If the rate has dropped 30 per cent or more on the same kind of content, the new followers are not really there.
Audience location and language
Most platform-native analytics expose a top-locations and top-languages breakdown of the follower base. A sudden spike in followers from a country the account has never targeted, or a language the content is not in, is the signature of bought followers from a follower-supply farm based there.
Comment quality
Real new followers leave specific comments that respond to the post. Bot followers leave a small set of generic comments ("great post", "nice", emoji-only) recycled across thousands of accounts. A scroll through the last week of comments tells you which one is happening.
Follower-to-following ratio of the new followers
Tap through the recent followers list. Real accounts follow a few hundred to a couple of thousand other accounts. Bot accounts often follow tens of thousands and post nothing. The ratio is visible at a glance.
Survival rate of the followers
Real followers stay. Bought ones get purged in platform sweeps every few months. A follower count that gains 10,000 in a month and loses 6,000 the month after is almost certainly running on bought audience.
The same checks are the cheapest sanity test on an influencer-marketing proposal. Before agreeing rates, run the engagement check, the audience-location check, and a quick scroll through the comment quality on the last ten posts. A creator with 200,000 followers and an engagement rate under 0.3 per cent is almost certainly running a padded audience, and the proposal is not the deal it looks like.
Common follower growth mistakes
- Treating follower count as the headline metric. In 2026 the metrics that actually predict reach and conversion are watch time, sends, saves, and engagement rate. Follower count is a useful credibility number and a weak proxy for actual audience. A reporting deck led with follower growth is a deck telling the wrong story.
- Buying followers to hit a number. The short-term lift in follower count is real and so is the drop in engagement rate that follows it, the algorithm response that cuts organic reach, and the public collapse when the platform purges the bots. The number ends up worse than it started.
- Follow/unfollow loops and engagement pods. The mid-2010s tactics still get sold occasionally. Both inflate the follower-count graph briefly, both leave the same engagement-rate signature as bought followers, and both are flagged by the platforms' behavioural systems and risk shadowbanning the account.
- Posting for the algorithm instead of the audience. Chasing every passing format trend (the trending audio, the format that worked for someone else last week) earns short spikes in reach and almost no follower conversion, because the people who see the post never see anything coherent on the profile. Picking a niche and staying in it converts a smaller share of viewers into followers, but the share who do follow are followers who actually engage.
- Posting inconsistently and expecting compound growth. Buffer's 2026 creator growth playbook found that creators posting in 20 or more weeks of the year earned around 450 per cent more engagement per post than sporadic posters. The same pattern shows up in follower growth: the cadence is the lever, not the size of any single post.
- Ignoring the profile while optimising the post. The follower conversion happens at the profile, not at the post. A profile with no clear bio, no pinned content, and a grid of unrelated topics will convert a tiny fraction of the viewers a single great post sends to it. The bio, pinned posts, and recent grid are the parts that decide whether a viewer follows.
- Cross-posting watermarked video between platforms. Instagram and YouTube both penalise content with a TikTok watermark in the recommendations algorithm, sometimes by 30 to 50 per cent, which kills the unconnected reach that would have brought new followers in. The fix is to export clean from the original platform and upload natively to the others.
- Reading benchmarks as targets. A brand aiming to hit 3 per cent monthly Instagram growth because that is the benchmarkends up gaming the metric. The useful question is whether the current rate is trending up or down against the account's own recent history and whether the new followers are engaging.
For the wider context follower growth sits inside, the engagement rate entry covers the metric that tells you whether the new followers are real, the algorithm entry covers what each platform's ranking system actually rewards, the feed entry covers why the For You and recommendation surfaces broke the old follower-equals-audience equation, and the content pillars entry covers the planning structure that drives the single-niche profile that actually converts viewers into followers.
Follower growth FAQ
What is a good follower growth rate?
On a monthly basis, a follower growth rate of 1 to 3 per cent is the working benchmark for a healthy Instagram account, with LinkedIn sitting in the same band, X and Facebook lower at 0.2 to 1 per cent, and TikTok much higher because the For You feed can lift a single video into the tens of thousands of followers in a week. Hootsuite's 2026 social media benchmarks report shows the spread directly: TikTok averages a weekly follower growth rate of around 197 per cent across industries, while Instagram and Facebook sit at low single digits. The honest read is that growth rates vary so much by platform and industry that the most useful comparison is against the same account a month earlier.
How do you calculate follower growth rate?
Subtract the starting follower count from the ending follower count, divide the result by the starting follower count, and multiply by one hundred to get a percentage. Socialinsider's reference piece on follower growth lays the formula out as ((Ending Followers minus Starting Followers) divided by Starting Followers) times 100. The choice that actually matters is the time window: weekly numbers are noisy on small accounts, monthly numbers smooth out single viral posts, and quarterly numbers are the version most marketing teams report on because they cancel out short campaign spikes.
Does follower count still matter in 2026?
Less than it used to and not for the reasons most teams assume. The For You feed on TikTok and the recommendations engine on Instagram Reels both distribute a lot of content to people who do not follow the account, so a video can earn millions of views from an account with five hundred followers. Followers still matter for connected reach (the slice of distribution that goes to people who already follow you), for the credibility signal a brand or partnership manager looks at when sizing a creator, and for the floor on baseline distribution that the account can rely on. They are no longer the headline metric. Hootsuite's 2026 algorithm guide and Buffer's growth playbook both lead with engagement and watch time rather than follower count.
How can I grow followers without buying them?
The interventions that actually move follower count over six months are the same ones that drive engagement: post on a consistent rhythm of three to five times a week, publish in the format the platform is currently rewarding (Reels and carousels on Instagram, sub-30-second videos on TikTok, document posts and long-form text on LinkedIn), reply to every comment in the first hour after publish, and pick a single niche the account is recognisable for. Buffer's 2026 creator growth playbook found, across 100,000 creators, that the ones posting in 20 or more weeks of the year earned around 450 per cent more engagement per post than sporadic posters, and that engagement is the precondition for the algorithmic distribution that brings new followers in.
Is buying followers a good idea?
No, and the reason is more practical than moral. Bought followers are bot accounts or low-quality real accounts that never engage with the content, which means the engagement rate on every post drops as soon as the bought followers land. The recommendation algorithms on Instagram, TikTok, and LinkedIn read that low engagement rate as a signal that the content is not worth distributing, so the organic reach drops with it. The account ends up with a higher follower number and worse distribution to the people who actually follow it. Most platforms also run periodic bot purges and the bought followers disappear in batches, leaving the account looking like it lost ten thousand followers in a week.