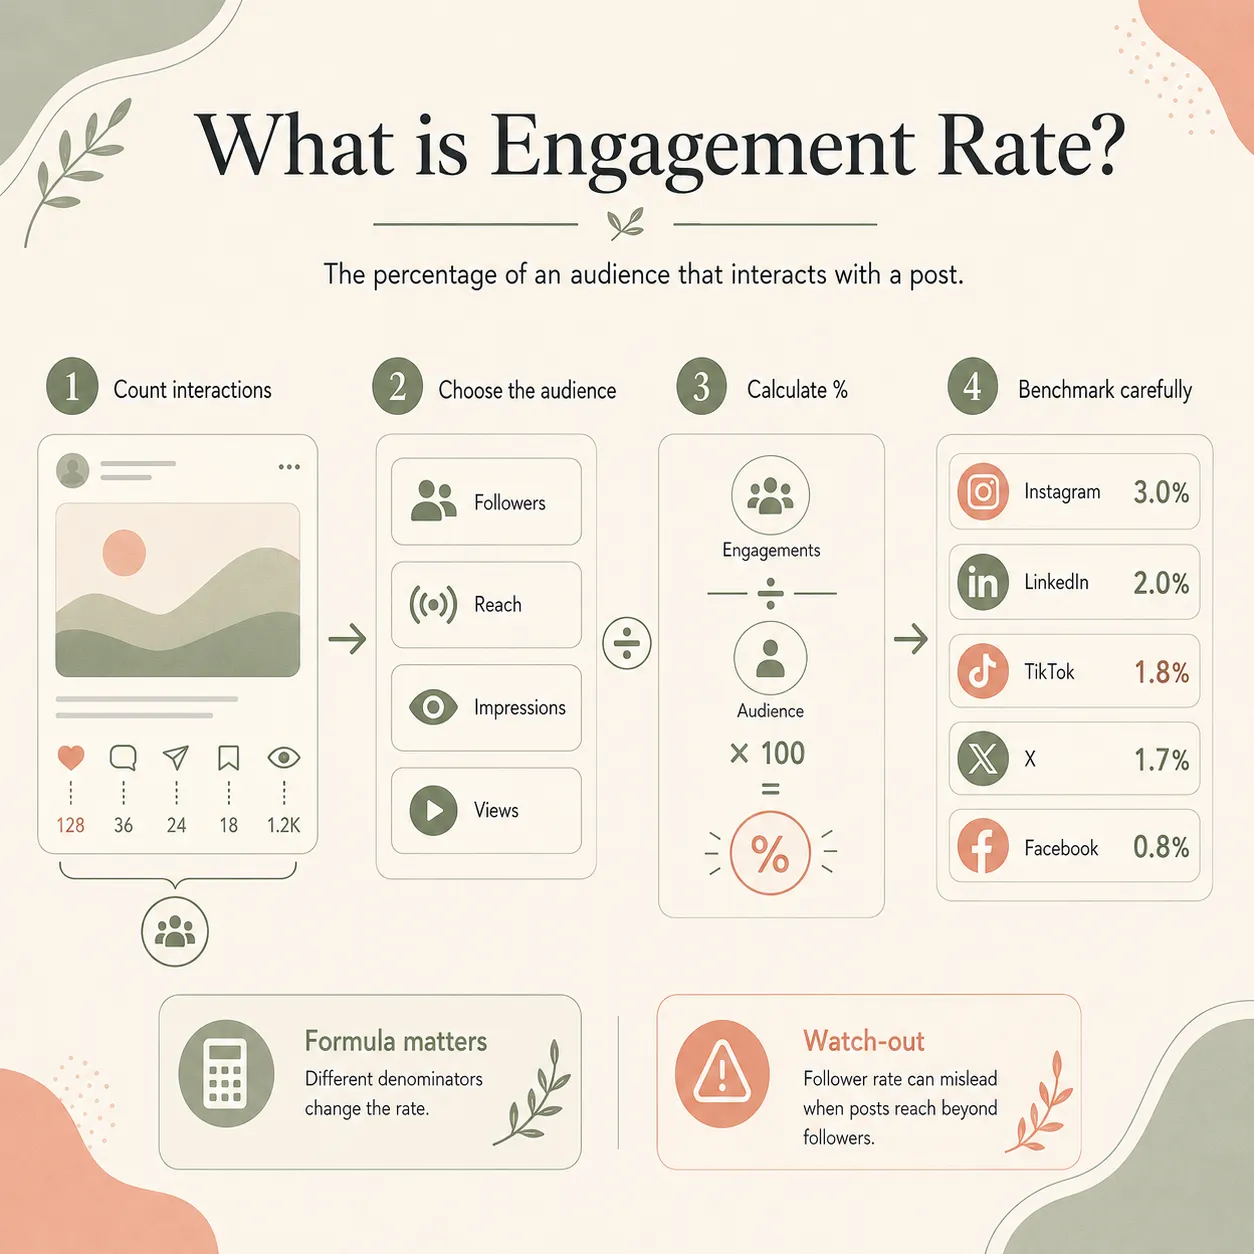
Engagement rate is the percentage of an audience that actively interacts with a piece of social media content through likes, comments, shares, saves, or clicks, divided by an audience denominator (followers, reach, impressions, or views) and multiplied by one hundred.
What is engagement rate?
Engagement rate, usually written ER, is the metric brands and creators use to answer the question follower count cannot: when a post goes up, do the people who see it actually do anything about it. Brandwatch's glossary entry on engagement rate puts the distinction cleanly: follower count tells you how many people could see the content, engagement rate tells you how many actually care.
The shape of the formula is always the same. Sum the engagements on a post, pick a denominator, divide, multiply by 100, get a percentage. The arguments that matter are about which engagements count, which denominator is honest, and whether the resulting percentage is on a comparable scale to the benchmarks people quote. Sprout Social's 2026 guide on Instagram engagement rate defines the metric as the percentage of an audience that actively interacts with content through likes, comments, saves, shares, and other actions, and that is roughly the consensus definition across the industry.
Engagement rate sits one level above raw engagement totals because it controls for audience size. A post with 200 likes on an account with 1,000 followers and a post with 200 likes on an account with 100,000 followers are wildly different stories, and the rate is what lets the comparison happen. Most brands use ER as the metric that decides whether a format is working, whether an influencer is worth paying, and whether the calendar should ship more of one kind of post and less of another.
What counts as engagement
The list of actions that count toward the numerator has crept over time. Likes, comments, and shares are universal. Saves joined the standard list around 2018 when Instagram started reporting them. Clicks (on links, on profile, on the swipe-up sticker before it became the link sticker) are usually included now. Sticker taps, story replies, and video reactions are platform-specific additions most analytics tools fold in.
Likes
The lightest engagement and the easiest to inflate. Worth tracking but not the most useful single signal because platforms now reward harder interactions more heavily in ranking.
Comments
Harder to earn and weighted more heavily by every recommendation system that publishes its ranking rules. Most weighted-engagement formulas score a comment at three to four times a like.
Shares and reposts
Strongest distribution signal because a share is the audience telling the algorithm to widen the post. Usually weighted at five to six times a like in weighted formulas.
Saves
The quiet bookmark that says someone intends to come back. Strong signal of utility-driven content (recipes, how-tos, lists) and weighted at two to three times a like on Instagram in particular.
Clicks
Counted on platforms that surface them: link clicks, profile clicks, hashtag clicks. The least conversational engagement and the most commercial; the one that matters most for paid campaigns.
Watch time (newer)
Not historically counted in ER, increasingly the strongest signal on TikTok, Reels, and YouTube Shorts. Most platform-native dashboards now publish an ER-by-views figure alongside the older formulas.
The honest version of ER picks the engagement set that matches what the brand is trying to do. A creator selling a course should care most about comments, saves, and clicks. A news account should care most about shares. A consumer brand running a feed of seasonal product shots can lean on likes and saves and reasonably ignore everything else. There is no single objective numerator; there is the numerator that lines up with the goal.
The main engagement rate formulas
Hootsuite's reference piece on calculating engagement rate lists six formulas, and the four that most teams actually use in 2026 are the ones that matter to know by name. The other two (daily ER and cost-per-engagement) sit slightly off to the side.
Engagement rate by followers (ER by followers)
Engagements on a post divided by total followers, times 100. The historical default, the easiest to calculate, and the one that breaks worst in 2026 because platforms now serve content well beyond the follower base. Useful for comparing yourself to past versions of yourself, not for comparing two accounts of different sizes.
Engagement rate by reach (ER by reach, ERR)
Engagements on a post divided by unique users who saw the post, times 100. The Hootsuite guide singles this out as the most accurate read of content quality in 2026, because it isolates the question of how compelling the post is to the people who actually saw it. The downside is that reach is a metric only the account owner sees, so this version is harder for competitors and influencer-buying tools to compute.
Engagement rate by impressions (ER by impressions)
Engagements divided by total impressions, times 100. Impressions counts every display, including repeats, so this number tends to be the lowest of the four. The version that paid campaigns and ads-driven accounts watch most closely because impressions are what the ads platform charges against.
Engagement rate by views (ER by views)
Engagements on a video post divided by total video views, times 100. The native default in TikTok and Reels analytics now, and the only formula that takes watch time seriously. Best for short-form video; misleading for still and carousel posts where view counts are not reported the same way.
The other two on Hootsuite's list are daily engagement rate (total engagements in a day divided by total followers, useful for rolling-week dashboards) and cost per engagement (total ad spend divided by total engagements, used on paid campaigns). Both build on the same numerator and denominator pattern as the four above.
The single most important habit in measuring ER is to pick one formula and apply it consistently to every report. A weekly ER number that quietly flips between followers and reach as the denominator is a number that tells you nothing about the underlying trend. The other habit is to label every ER number with the formula that produced it, because the moment a stakeholder reads 4.3 per cent without the formula attached, they are going to compare it to whatever benchmark they last saw, which was almost certainly computed differently.
Why two tools report different engagement rates
The most disorienting thing about ER for anyone new to the metric is that two reputable analytics companies, working from the same kind of public data, can publish very different headline numbers for the same platform in the same year. Socialinsider's 2026 social media benchmark report puts Instagram engagement at 0.48 per cent and TikTok at 3.70 per cent off an analysis of 70 million posts. Buffer's state of social media engagement 2026 report puts Instagram around 5.5 per cent and TikTok around 4.6 per cent off a sample of 52 million posts.
Both numbers are correct on their own terms. Socialinsider is running engagements over followers; Buffer is running a different denominator (closer to reach and impressions on the platforms that expose those numbers) over a different set of accounts with a different profile. The same gap shows up every year across every benchmark publisher: the Hootsuite 2025 numbers, the Sprout 2026 numbers, the Socialinsider numbers, and the Buffer numbers will all disagree, and they are all measuring real activity.
The practical move when a stakeholder waves a benchmark around is to ask which formula it came from and how the sample was built. If the answer is unclear, the benchmark is unusable for direct comparison. The most useful version of external benchmarks is directional: in 2025 Instagram engagement was roughly flat year-on-year, TikTok engagement was rising sharply on most denominators, and Facebook had stabilised at a much lower band. The exact percentage that counts as average depends on the formula.
Engagement rate by platform (Instagram, TikTok, LinkedIn, X, Facebook, YouTube)
Different platforms reward different actions in their algorithms, expose different metrics in their analytics, and sit at very different baseline engagement rates. The numbers below are 2025 cross-platform averages from Hootsuite's engagement rate guide, computed on ER by followers, with format-specific notes from the platform-native benchmarks published by Socialinsider and Sprout. Use them as orientation, not as a target.
Hootsuite's 2025 cross-industry average is 3 per cent on ER by followers, with Reels coming in at 2.7 per cent. Socialinsider's 2026 benchmark on the same denominator drops the number to 0.48 per cent, mostly because the sample includes very large accounts where the denominator dwarfs the engagements. Carousels remain the strongest format on engagement in both datasets. Sprout puts the bar for a good Instagram ER at 1 per cent or higher.
TikTok
The platform that has moved the most in 2025 and 2026. Hootsuite's 2025 average is 1.8 per cent on ER by followers; Socialinsider's 2026 report puts the same number at 3.70 per cent, up 49 per cent year-on-year. The fairer read on TikTok is ER by views, where the native dashboard surfaces watch-time-led metrics, and where 8 to 15 per cent is a common high band for accounts that hit the For You feed.
Hootsuite's 2025 cross-industry average is 2 per cent on ER by followers, and LinkedIn is the one mainstream platform where the ER-by-followers number is still a reasonable proxy because its feed is more follower-based than the others. Carousels and document posts are the strongest format by a noticeable margin, and the ER ceiling on B2B content tends to be higher than consumer content.
X (formerly Twitter)
Hootsuite's 2025 average is 1.7 per cent on ER by followers, with Socialinsider's reporting much lower numbers (0.12 per cent in 2025, down from 0.15 per cent the year before). The For You feed has pushed X engagement away from follower-based measurement entirely. Most teams measure X on raw impressions and replies rather than a tidy ER figure.
The slowest platform on engagement and the one that has held steady at the bottom of the cross-platform tables. Hootsuite's 2025 number is 0.8 per cent on ER by followers; Socialinsider's is 0.15 per cent. The format-level variation is real (video and live still pull noticeably more engagement) and the baseline is genuinely lower than every other platform.
YouTube
ER on YouTube is split between long-form videos and Shorts, with different denominators. Long-form uses ER by views (likes plus comments over views) and a 5 to 8 per cent band is normal for a healthy channel. Shorts behaves more like TikTok, with much higher view counts and engagement spread thinner across the audience.
The mismatch between Hootsuite and Socialinsider on the same denominator is not a contradiction; it is the difference between a cross-industry rolling average and a sample weighted toward large accounts. The takeaway is that benchmarks are useful for orientation and roughly comparing a brand to itself over time, and almost useless for declaring whether a specific account is above or below some precise platform-wide threshold.
What is a good engagement rate?
The version most teams use as a working answer comes from Sprout's Instagram engagement rate guide, which lays out four bands on ER by followers: below 0.43 per cent is below the platform median, 0.43 per cent to 1 per cent is at or near average, 1 per cent to 3 per cent is strong performance, and 3 per cent or higher is exceptional. The bands work as a rough mental model for most feed-based networks, with the usual caveat that LinkedIn skews higher and Facebook lower.
The more useful question than what is a good ER is what was my ER last month and why has it moved. A brand whose Instagram ER drops from 4 per cent to 2.4 per cent over a quarter has a real problem to investigate, whether or not the new 2.4 per cent number sits above some external benchmark. A brand whose ER climbs steadily from 0.6 per cent to 1.1 per cent has a real win, whether or not it has crossed into the good band yet.
Influencer engagement rate is a separate conversation, because the question there is whether the audience is real. A legitimate creator at 50,000 followers will sit in the 2 to 5 per cent band on most platforms. A creator at the same follower count with an ER under 0.5 per cent and very few comments is almost certainly running a follower base padded with bought accounts, and the cheapest sanity check on an influencer proposal is to run the ER calculation on the last ten posts before discussing rates.
How to actually improve engagement rate
The interventions that actually move ER are not the ones the social-media-tip industry leads with. They are slower and less photogenic and they show up in the data inside a couple of months. Buffer's 2026 engagement report found, across 52 million posts, that the single most reliable predictor of an above-average ER was whether the account replied to comments consistently, with response-driven lifts of 5 per cent on Bluesky and up to 42 per cent on Threads.
- Reply to comments inside the first hour. Every platform's ranking system reads the post as worth pushing harder if the conversation is alive in the window after publish. A reply in the first thirty minutes earns more downstream engagement than a reply two days later, and most of the lift in Buffer's data traces back to this single behaviour.
- Write the first line for the scroll. The first line of the caption is the lever that decides whether the audience reads on, which decides whether they save or comment, which decides whether the post lands on a for-you-page. The caption entry covers what the opening line has to do on each platform.
- Ship the format the platform is rewarding. On Instagram in 2025 and 2026 that is carousels for engagement and Reels for reach. On TikTok and Shorts the first three seconds of the video are doing more work than the rest combined. On LinkedIn document posts and carousels continue to outperform text-only posts.
- Ask, don't announce. Posts that end with a real question or a small ask of the reader pull comments at noticeably higher rates than posts that simply state. The ask has to be specific enough to answer; a generic thoughts? at the end of a paragraph does not count.
- Cut the posts the audience is skipping. A brand running five posts a week with two of them at ER well below the account average will lift its overall ER simply by dropping those two. The temptation to fill the calendar is real, and the fastest path to a higher ER is usually fewer posts that work harder.
- Tie post planning to content pillars rather than fill-the-grid logic. ER goes up when the account has three or four clear themes the audience recognises and goes down when every post is a different topic. The pillars are the structure the algorithm rewards.
Common engagement rate mistakes
- Comparing ER from different formulas as if they were the same number. The Buffer 5.5 per cent for Instagram and the Socialinsider 0.48 per cent are not the same metric and putting them on the same line of a deck is the fastest way to make a quarterly review meaningless.
- Using ER by followers on a TikTok account. TikTok's feed is not follower-based, so the follower denominator is measuring against a number the algorithm does not really respect. ER by views is the honest formula on TikTok and Reels.
- Chasing the benchmark instead of the trend. A brand reading that 3 per cent is the Instagram averageand trying to drive every post to that number will end up gaming the metric. The useful question is whether the current ER is trending up or down against the account's own recent history.
- Inflating ER with giveaway posts and then quoting the average. A giveaway will pull a single-post ER three to four times the account's typical level, which then pulls the monthly average up. The number is real for that post and misleading as a steady-state read on content quality.
- Counting bot likes and bought followers in either side of the formula. On the numerator they inflate engagement; on the denominator they suppress ER by followers. Either way the number is wrong, and the fix is to actually audit the follower base periodically.
- Buying influencer placements without checking the ER. The ER calculation on the last ten posts of a proposed creator is the fastest tell of whether the audience is real. Sub-0.5 per cent on an account with hundreds of thousands of followers is almost always a padded follower count.
- Ignoring the per-platform analytics in favour of a spreadsheet roll-up. Each platform's native dashboard now exposes additional context (watch time on TikTok, saves on Instagram, dwell on LinkedIn) that a flat ER spreadsheet flattens out. The roll-up is fine for trend reading; the per-platform views are where the real diagnosis happens.
For the wider context engagement rate sits inside, the analytics entry covers the broader reporting layer ER is one number inside, the algorithm entry covers what each platform's ranking system actually rewards, and the caption entry covers the writing that decides whether a post earns the comments and saves that drive most of the ER number.
Engagement rate FAQ
What is a good engagement rate on social media?
The honest answer is that it depends on the platform and the formula. Sprout Social puts the bar for a good Instagram engagement rate at 1 per cent or higher when calculated against follower count, which places an account in the top 25 per cent on the platform. Hootsuite's 2025 cross-platform numbers come in at 3 per cent for Instagram, 1.8 per cent for TikTok, 2 per cent for LinkedIn, 1.7 per cent for X, and 0.8 per cent for Facebook. Anything noticeably above the relevant benchmark, on the relevant formula, is a useful signal that the content is hitting.
How do you calculate engagement rate?
Sum the engagements on a post (likes, comments, shares, saves, and on most platforms now also clicks), divide by an audience denominator, and multiply by 100 to get a percentage. The four denominators most teams use are followers, reach, impressions, and video views. Followers gives a stable but pessimistic number; reach gives a higher number based only on people who saw the post; impressions counts every display, including repeats; views is the version most TikTok and Reels analytics now lead with.
What is the difference between engagement rate by reach and by followers?
Engagement rate by followers (engagements divided by total followers) tells you how much of the wider audience you have built up actually interacts with a post. Engagement rate by reach (engagements divided by unique users who saw the post) tells you how compelling the post is to the slice of people who actually saw it. Reach-based numbers are almost always higher than follower-based ones because the reach denominator is smaller, and on platforms where the algorithm distributes content well beyond followers (TikTok, Reels, X For You) the follower-based formula is increasingly misleading.
Why do different tools report different engagement rates?
Because they are using different formulas on different denominators. Socialinsider's 2026 benchmark report lists Instagram engagement at 0.48 per cent and TikTok at 3.70 per cent based on engagements per follower. Buffer's 2026 report, working from the same kind of post-level data but a different denominator, puts Instagram around 5.5 per cent and TikTok around 4.6 per cent. Both are correct for their formula. The trick is to pick one formula, apply it consistently, and ignore the inevitable arguments about which industry benchmark someone is quoting at you.
Do views count as engagement?
Most of the older definitions say no, on the grounds that scrolling past a video is passive consumption rather than interaction. In 2026 that line is harder to defend on TikTok and Reels, where the algorithm itself treats watch time as the strongest engagement signal it tracks, and most platform-native analytics now expose an ER by views figure alongside the older formulas. The practical compromise most teams have settled on is to track ER by views for short-form video specifically and the standard formulas for still and carousel posts.