Instagram Insights gives you more data than most creators know what to do with — but only a few numbers actually change how you should post.
Instagram Insights is the built-in analytics dashboard available on professional and creator accounts. It shows reach, impressions, engagement, follower demographics, and content performance. The problem is not a lack of data. The problem is knowing which numbers matter for your goals and which are noise.
Most people check Insights after a post goes live, glance at the like count, and move on. That misses the more useful signals: reach tells you how far the content traveled, saves and shares tell you how valuable people found it, and profile visits tell you whether the content made someone curious enough to learn more about you.
This guide explains what each Instagram Insight actually measures, which metrics matter for different goals, and how to turn Insights data into better posting decisions instead of just checking a scorecard.
Instagram post Insights: reach, impressions, and the difference
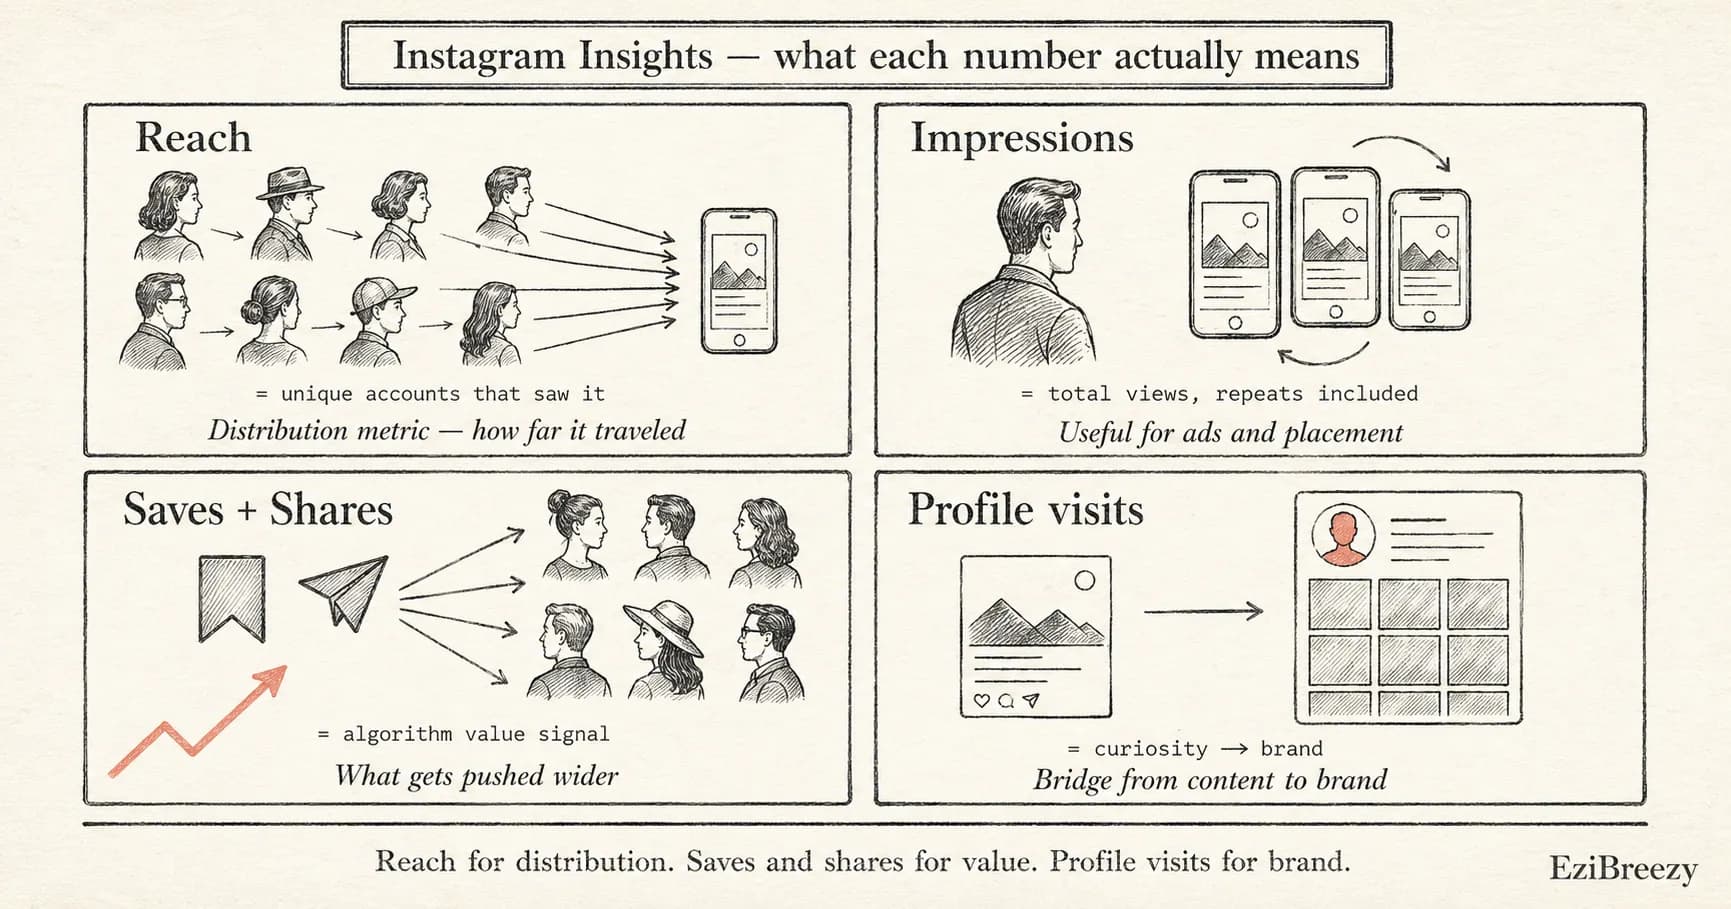
Reach and impressions are the two most commonly confused Instagram metrics. Reach counts the number of unique accounts that saw your post. Impressions count the total number of times the post was displayed, including repeat views from the same account. A post with 1,000 reach and 1,500 impressions was seen by 1,000 people, some of whom saw it more than once.
Reach is usually the more useful metric for understanding how far your content traveled. High reach means the post was distributed beyond your existing followers, often through Explore, hashtags, Reels recommendations, or shares. Low reach on a post with strong engagement from your existing audience might just mean the algorithm kept it inside your follower base.
Impressions are more useful when you are comparing ad performance or trying to understand how many times a piece of content was shown in a specific placement. For organic posting, reach tells a clearer story.
Instagram Scheduler
Use Instagram Insights to find your best-performing content and posting windows, then schedule more of what works.
Explore the Instagram schedulerPlan, preview, and publish in one workflow
Instagram Insights that show content value: saves, shares, and profile visits
Likes are the most visible engagement metric, but saves, shares, and profile visits are often more meaningful. A save means someone found the content useful enough to come back to later. A share means someone thought it was worth passing along. A profile visit means the content made someone curious enough to check out the account.
Saves and shares are particularly important for Instagram's algorithm. Content that earns high saves and shares relative to its reach tends to get pushed to wider audiences because those actions signal genuine value, not just casual approval.
Profile visits are the bridge between content performance and brand building. If a post drives a spike in profile visits, that is a strong signal that the content is doing brand-building work — making new people curious about who you are and what you do.
Saves signal lasting value
Bookmarked content is content worth keeping
Posts with high save rates are usually educational, actionable, or reference-worthy. If you want more saves, create content people will want to revisit.
Shares signal social proof
Shared content reaches new audiences
When someone shares your post to their Story or sends it in a DM, it reaches people you could not have reached on your own. Shares are the strongest organic distribution signal.
Profile visits signal brand interest
Curiosity that leads to the profile
A spike in profile visits after a post means the content made people want to know more. Track which posts drive profile visits to understand what builds your brand, not just your engagement.
How to use Instagram Insights to improve your posting strategy
The most practical way to use Instagram Insights is to compare content over time instead of judging each post in isolation. Look at the last 30 days of content and identify which posts earned the highest reach, the most saves, and the most profile visits. Those are your strongest formats and topics.
Use the audience activity data in Insights to find your best posting times. The Audience tab shows when your followers are most active by day and hour. Post your best content during those windows to give it the strongest start.
Build a feedback loop: check Insights weekly, note which content types and topics performed best, and schedule more of what works. The goal is not to obsess over every number, but to make one or two better decisions per week based on what the data actually shows.
Instagram Insights is most useful when you stop treating it as a scorecard and start treating it as a feedback loop. The numbers are not there to make you feel good or bad about a post. They are there to help you make better decisions about what to create next.
Focus on reach for distribution, saves and shares for content value, and profile visits for brand building. Use the audience activity data to find your best posting times. And review the data weekly so each batch of content is slightly better informed than the last.
The creators and brands that grow on Instagram are not the ones who check Insights the most. They are the ones who act on what Insights actually tells them.
Related tools
Engagement Rate Calculator
Compare follower-based, reach-based, and impression-based engagement rates using numbers from your own Instagram Insights.
Social Media Report Template
Turn Instagram Insights data into a structured monthly report with KPI cards and content highlights.
Instagram Grid Planner
Preview how the next posts will sit together on the profile before scheduling them.
Instagram Hashtag Generator
Find relevant hashtags to improve reach on the content types that Insights shows are working.
Turn Insights into a better posting rhythm
Find what works in your Instagram Insights, then schedule more of it at the right times with a calmer publishing workflow.
Start planning in EziBreezy